Updated January 17, 2016 Watts vs. Speed Cyclists: here you will find three (3) graphs for watts vs. speed plus Calculator for Watts to Speed plus Race Category per Power to Weight measurements and more regarding cyclist power & speed. The graphs and Race Category table look like this:
The live version of this file has been moved to: Cycling Performance Simplified Links to calculators for speed to watts are found at the very bottom but are also copied immediately below for your convenience:
Links to original source materials are also at the bottom of this page. The page you are now on was originally begun in July of 2007 during my own search which was probably similar to yours that brought you here today. Since 2007 I have worked out the details to my own satisfaction, and this page remains part of the history of the search and testing which was formalized into the book:
Below is the original version of this page that you are now on as it was first published here in 2007. My quest for a simple formula to get a ballpark figure on how many continuous watts Mary will have to average for her 23+ Hump continues. I hate to waste everybody's time by not providing the simple answer, but maybe somebody will know it, or know where to find it. Just don't start some endless he said, she said Chatter Box forum crap. I am sure there is a formula (amenable to plugging into a spreadsheet) to answer the following question:
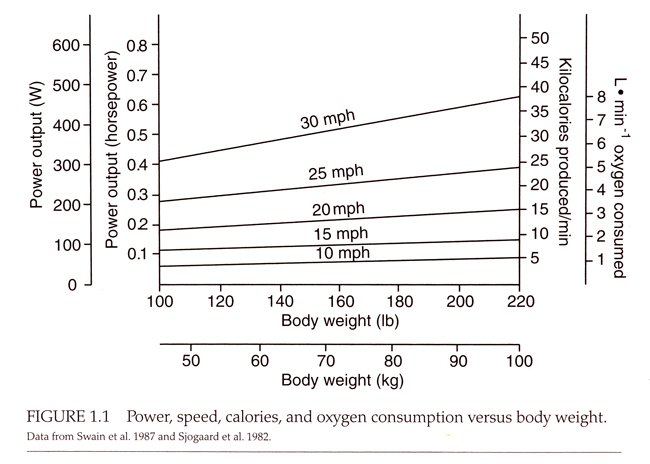
I have seen numerous references to this concept, and lots of side issue charts and graphs, but I'm telling you, my friend, somewhere there is a simple answer to this with at least as much veracity as the rule of thumb for HR, which is 220 minus your age... which of course always gives a figure nothing like an actual person's HR. I explained it to Mary thus: "Look, it's a simple concept. Everybody, and every ride, and every bike, and every wheel, and every day, and every pedal, and every jersey, and every helmet, and every rider is different. I give you that. But there are absolutely no riders who are ten feet square weighing 10,000 lbs. (discounting Zirra), and there are no riders four inches tall weighing a pound and a half (discounting Miguel), so there is a range within which one can say: THIS WEIGHT x THIS WATTS = THIS SPEED. Plug in your numbers." Bikes, components, clothes, and weight are pretty much minimal for making this calculation. The only significantly strong variable is the air resistance. Air is elastic, and the problem is that the harder you push it, the harder it pushes back. However, it doesn't push back harder in some willy-nilly any-old-way fashion. It increases its push back in a regular and predictable manner, so you would think the first thing off everybody's lips who has anything resembling a discussion about this would be the exact logarithmic constant for how it does that. But no... everybody wants to spend three or four hundred pages explaining how good aerodynamics, and great equipment is going to make you faster, and how the fastest stuff is the stuff they just happen to be selling. Otherwise, everybody is rather reluctant to give you specific information about just how much faster that equipment is likely to make you. Once a long time ago (this isn't a totally new quest for me), I had a conversation with a sales rep for Mavic about their then new Kyserium's. It went like this, "Really, those little cutouts make the wheels a lot faster? Great! Could I see the wind tunnel specs?" Mr. Mavic, "Well, we aren't allowed to publish those specs, because in Europe it is illegal for us to say anything bad about our competitors." And I thought, "I guess it's ok for you to say bad things about yourself in this country." Later I was helping somebody write an article for one of those big-time glossy sports magazines. I was only doing some proofing and copy editing, they had the knowledge and were in charge of the content. I bailed out of the project immediately on hearing the person was going to change the facts in the article because the magazine said, "That is all true, but we can't print it, because of our advertisers." So I'm not surprised that nobody wants to come right out and tell you exactly how much that extra $8,000 is going to buy you in terms of your own performance. I've been around this block on my bike. In any case, now with our watt meter we have a great resource for getting valid reliable repeatable feedback on performance in real time (or close to it) and on an actual ride. Finally, a no bullshit ride-ometer. The Widder has one, and it has allowed me to explain concepts to her which she would never have believed without it. Plus, it gives us the ability to establish a controlled performance beyond any dreamed of finesse that would be possible without it. Still, I am totally pissed off at how hard it has been to find a solid baseline figure. The two books I was waiting for, in hopes of finding a reliable formula for the ballpark wattage for the Widder's Hump, came today and proved more or less worthless. Same ol' same ol' regarding jumping from lovely distraction to lovely distraction, but not a solid word on the most basic issue of watts vs. speed. I did find this chart on page 2 of one of them, and it sure as fuck came close:
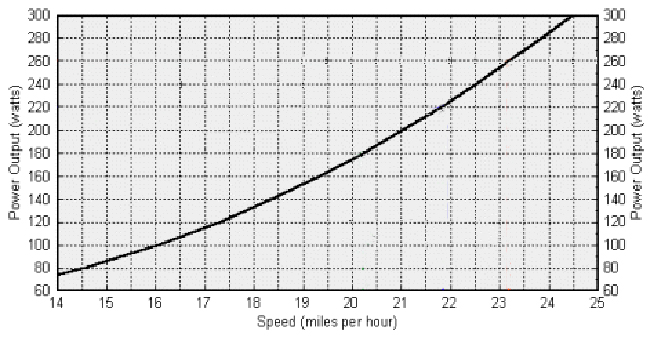
If this chart can be trusted, the figures I extrapolated in the chart on Fort De Soto page were more accurate than I had thought. Plus, they were happily just slightly conservative. Maybe we can go a little faster with a few less watts than I calculated. Considering we just did a 19.8 avg with only 170 watts as target (which Mary is getting pretty good at hitting), that puts my previous calculations closer to what would be the expected as an ideal performance according to the chart above. You will note that Mary's 23+ Hump goal lies just between the ranges shown above. I got excited to trace back to a formula so that I could plug in Mary's exact weight, and exact 23+ to get a more precise reading. Guess what? The references at the bottom of the figure were to two studies which were not given in the reference index. Who the fuck knows what periodical is referenced, what methodology was used, what players, what etc. I read the rest of the text anyway. Turns out the graph is merely a charting of empirical studies. Also turns out our own study is just as valid, in fact probably more so given the circumstances. Anybody knowing a formula for rule of thumb calculation for weight and watts vs. speed while wearing tight clothes and riding a suitable road bike on a flat and windless course, give us a buzz. Otherwise, don't bother me until somebody decides to take this shit seriously and get rational about it. 02/11/08: Mary found the graph below which is more refined than the one above, plus it is taken from Computrainer specs. A formula into which one might plug numbers is yet to be found, but this chart is one step closer.
You will note that this chart shows the increase in watts and speed as a curve, not a line. It is a logarithmic, not a linear, progression. That's what I've been screaming about... partly. You will also note that this graph has a finer division of numbers, plus it repeats the watt values on both sides of the graph. Including numbers on both sides of an actual graph facilitates interpolating through using a straight edge. The earlier graph required establishing your own perpendiculars in order to guess at the numbers between the ones which were stated, and having to do that placed all the numbers into question. Was the other graph a true scale graph or merely a vague representation meant merely to aid in presenting a point? Turns out the original graph was only a graphing of the results of an empirical study, so a straight line was sufficient. We need better data for the Widder, and the graph above is getting us closer. The green, blue, and red lines shown (with the percentages) are to help explain that once a person moves outside optimal wattage (based on their own performance ability), they receive only marginal benefit in speed compared to the significantly greater effort. Voilà! Additional support for my calculations and how we are approaching the 23+ Widder's Hump. Also an unstated truth illustrated by this chart is something that I have been trying to explain to Mary. Objects function best within a certain parameter range and moving either direction (faster/slower, or harder/easier) is a matter that requires a method to achieve the skill in both directions. More on that later. For the chart below, I used the one above
then erased the differencing lines that illustrate percentage of effort
relative to percentage of speed increase. This will simplify the
discussion regarding the basic concept.
More speed on a flat course at sea level air pressure with no wind can be generalized and reduced to a logarithmic curve. Deriving a baseline wattage requirement in terms of wattage in order to complete any given course at a given mph average can then be found by picking the intersection of watts and mph which matches. With that basic information as a starting point a training program can be carefully designed around a rational goal. The graph assumes a normal human, with a modern road racing bicycle and appropriate clothing. No extreme measures in terms of aerodynamic design, exotic geometry, extraordinary materials have been addressed in the graph. This is merely a basic view of general functional kinetics according to basic classic physics. Nothing to it. The fine tuning begins from here. First we determine a specific athlete's current capacity through careful testing using a variety of methods, measuring tools, and real world performance observation. Secondly the specific course to be mastered is reviewed to see if any extraordinary elements exist which require special attention. As of 02/14/08, we have assessed the baseline of The Widder's current performance level and have begun work on improving it through studies in technique and a variety of staged resistance exercises. We have also identified the first obstacle to be addressed on The Hump. The major challenge with Mary's 23+ Hump will be the downhills. Her body weight and power ratio have proven more than adequate for the uphills, however, she will have problems keeping a high enough wattage on the downhills to keep her average in the 23+ mph range which is nominally just below 260 watts. The most extreme example of this will likely occur on the Oil City Road downhill. That is the steepest downhill on The Hump, and she will certainly be spun out by the half way point. Thus she will be drawing zero watts for about an eighth of a mile. Our current plan is to make up the wattage lost on the Oil City downhill by increasing wattage used on the Dog Hill Climb before it. That uphill poses a very close analog to the Oil City downhill, and it is about a mile and a half before it. So the proximity will allow reassessing performance of the record attempt during the attempt itself. If something goes wrong, there will be plenty of time to make up the difference using a slight adjustment throughout the remainder of the ride. There is approximately 18 miles remaining at that point. We believe having Mary push above her 260 watt goal on the Dog Hill climb, she will be still be able to recover enough to maintain her wattage for the rest of the ride. We hope that her momentum lost on the Oil City downhill (due to not being able to apply any wattage at all ) will not be so severe that a little wattage bump on Dog Hill will fail to make up the difference. We will be doing specific testing of this idea once we return to NY where we can perform reconnaissance rides plus conduct workouts on the course. In the meantime we continue to improve Widder's performance specs and skill sets with her winter workouts on the local trails and roads. 02/15/08: Google search for "speed and watt calculator" found the following top return: Bicycle Power and Speed Calculator (Once there, click on the image of the calculator.) Also found was this online calculator for power while climbing (no wind resist considered):
Cycling Power while Climbing Calculator
Also you might like to use: Super Simple Power to Weight Calculator which includes this Race Categories Chart:
Burke, Ed. 2003. "High-tech cycling." 2nd ed. Champaign, Ill.: Human Kinetics. ISBN: 0736045074 Wilson, David Gordon, Jim Papadopoulos, and Frank Rowland Whitt. 2004. "Bicycling science." 3rd ed. Cambridge, Mass.: MIT Press. ISBN: 0262731541 Online Firth, Malcom. A Look At Time Trial Pacing Strategy by Malcolm Firth ABCC Senior Coach Wright, Gordon Dr. High Performance Interval Training by Dr. Gordon Wright ABCC Senior Coach Cycle Coaching Magazine subscription info
this page last updated:
01/17/2016 11:39:16 AM |
||||||||||||||||||||||||||||||||||||||||||||||||||||||||||||||||||||||||||||||||||||||||||||||||||||||||||||||||||||||||||||||||||||||||||||||||||||||||||||||||||||||||||||||||||||||||||||||||||||||||||||||||||||||||||||||||||||||||||||||||||||||||||||||||||||||||||||||||||||||||||||||||||||||||||||||||||||||||||||||||||||||||||||||||||||||||||||||||||||||||||||||||||||||||||||||||||||||||||||||||||||||||||||||||||||||||||||||||||||||||||||||||||||||||||||||||||||||||||||||||||||||||||||||||||||||||||||||||||||||||||||||||||||||||||||||||||||||||||||||||||||||||||||