|
[
Hump
|
Timeline |
Clearwater Bridge |
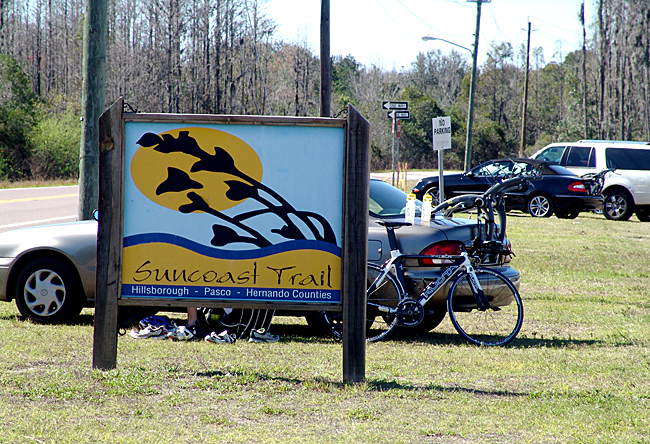
Suncoast Trail |
Fort De Soto Park |
Pinellas Trail |
Watts Compared
] (photos at bottom of page) this page last updated: 02/01/2015 10:39:06 PM 01/29/08: Planned was our regular 6 mile 86-89 warm-up then and extended pace interval at 180 > 200 watts to confirm Mary is capable of it, plus confirm real-world is close match to theoretical expectations. Figures in columns 1 & 2 on chart below, and under the gray line, are taken from the original article, figures above the gray line are calculated based on extrapolation using the rate of change shown in the final column. Today we are going to try to confirm that 180 watts does equal 20.6 more or less.
Results: We did not get a good check on the watts/mph real-world specs, because Mary had to bail out after 8:57 minutes of 200 watts. We dropped down to warm-up watts for the rest of the trip out, then spent the return trip working on smoothing out her spin by checking watts, looking away, glancing back to check (and adjust if needed), memorizing the feeling then looking away again. She began with 80-90 watts. Once proficient in that range she moved up to 90-100 and so on to 125. Mary found that the 120 range was the easiest to maintain without variation. I rode back off to the right of her wheel, so I could check her concentration and see if she appeared to be responding to wind and grade changes quickly enough. If she did not respond quickly, I would prompt her to look down. I feel wattage changes a lot faster than she does, not to mention faster than her watt meter reflects it. Being a fat fuck has finally paid off. Mary got real good at feeling the watts (and by golly responding) by the end. We did one final 5:35 200 watt pace interval at the end. She used all she had learned on the spin exercises, and confirmed to herself that the 200 watts was in fact a lot easier to hold after smoothing out her spin. After our last interval Mary did a couple miles standing for balance. She is getting a lot smoother and better at putting weight on her left foot. Also her saddle might be causing some sciatic type discomfort, because it has broken down and is putting pressure on her inside left thigh. She will swap it out in the morning. Because of the watt meter, this was the most enjoyable day we've ever had on the Suncoast Trail. When we turned back into the wind for the return trip, we allowed watts to dictate the ride, not speed. Therefore, we actually still felt like humans at the end. Always before on the Suncoast Trail, we have been so burnt out by the return loop that we have vowed never to ride it again. Today, Mary had an epiphany regarding what an incredible resource this trail is. We could never have completed today's fine tuning precision, if this trail did not provide 4 mile stretches without a break, with nobody on the trail other than a few serious cyclists. Joggers, roller-bladers, and Pokers never get very far out from the parking lots. Anybody who does get out into the hinter-trail is a rather safe person to be around. A cyclist coming off the trail when we arrived suggested, "My advice is to go north until sunset (6 hours), when the wind turns. I could barely hold 11 mph all the way in." We did better than that, but then... we are animals. 02/10/08: Today's Suncoast Trail plan was to warmup, then spin an easy 160 watt for an out and back recovery ride, while adding data to my quest of confirming my calculations. Everything went great, except my HR monitor showed a 234 max. That is certainly a computer glitch, and I must have gotten too close to Mary's chest strap, or to a power line. Our 20 mile test section went out into the wind and came back with a tailwind. Mary did a good job of holding near 160 watts for an 18.2 avg. That's a little slower than the loop we did in Fort De Soto on 02/02/08 at nominally the same watts, but the Fort De Soto loop ends 4 miles short of a full circle, and that day it was the short leg of the loop which was into the headwind. Therefore the ride was weighted a little toward having a tailwind. Today's test was even-steven out and back. Also, Mary's performance today was a little rough (she had an achy glute from yesterday's sprints), so her less than optimum form put a damper on her watts to speed ratio. We decided today that 160 is too many watts for a recovery day. However, there was all that sun, and so many people to catch on the trail. Hard to resist. Although I am still desperately looking for an authoritative mathematical model for watts vs. miles per hour considering the exponential increase of air resistance at greater speeds, the establishing of that baseline is only the first step. Rider performance and form will then be considered in light of that theoretical absolute. In the meantime, we have gotten to the point of being able to predict speed to watts based on a minimal quality of performance, and the numbers we are recording have been validated in the chart of third party real world measurements below. At the last minute before leaving for the Suncoast Trail today, we almost didn't go, because Humberto sent us a sampling of results for his group's early season Computrainer workouts. I almost stayed home to review the data, because I saw right away that it confirmed my calculations are definitely on course.
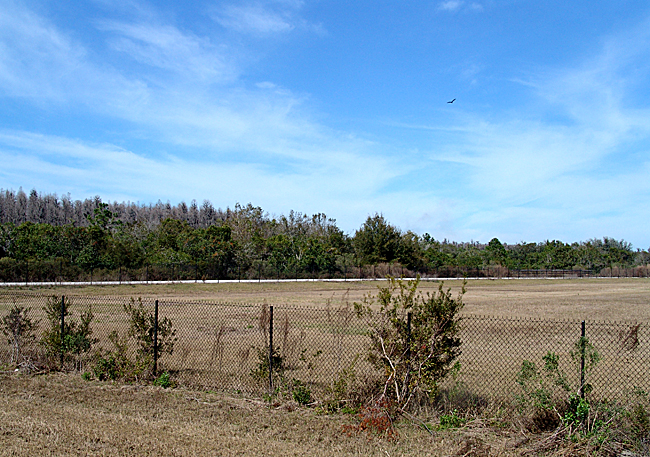
If most of the guinea pigs above were not actually racing, I would tell you who they are and explain the insight that each line gives into their training, state of fitness, and temperament. In fact, I could do a dissertation on just these results, but I will only say that Pig#7 obviously needs a little assistance (looks like drafting was turned on), and the Widder was very excited to realize #7's watts were similar to her current performance but at a significantly higher body weight. Plus, her own performance is somewhat more efficient. Otherwise, I'm sure you only wish you knew who all the riders are, but I'm not going to help you beat them. With Humberto helping them (and they helping him), beating them is not going to be so easily done anyway... so get crackin' on your own training. Even though I pleaded for it, the chart above was a totally unexpected gift. The number of elements in our current program which are confirmed by the figures shown (along with knowing who is doing which) could fill volumes. I am now excited more than ever about Mary's prospects for her 23+ Hump, because it is my understanding that every person above (except one) has done 23+ and better. There are champions (who win races) numbered among them, so seeing just how closely their Computrainer results (solid data) follow what I have theorized as a baseline perfection for watts vs. speed, and also how the results above relate to the unique methods we are employing to approximate that theorized perfection... well, it all just shines a clear light on the path to Mary's goal. Thank you, thank you, thank you, Humberto—not to mention all you guinea pigs on the chart who might have something (a race) to lose if I named you out loud. Here's a photo from today's ride.
02/10/08: 160 watt 18.2 avg
(25.8 max)
(per Excel: 18.16) / Polar: 1:05:44 / 19.9 m / BF avg HR 134
max [234]
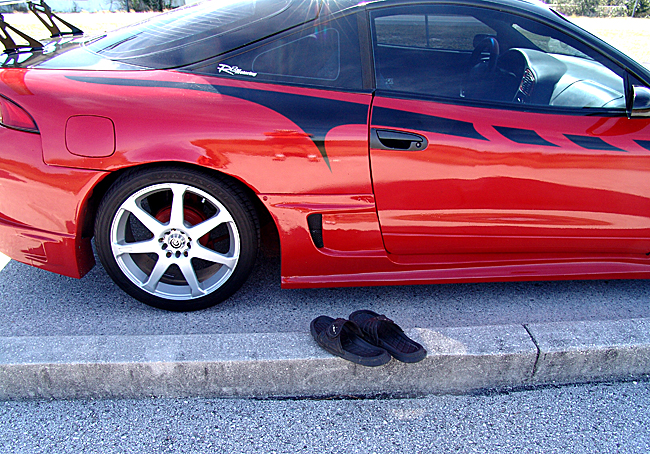
Keep scrolling down: Don't miss the
close-up shot below. this page last updated:
02/01/2015 10:39:06 PM |
|||||||||||||||||||||||||||||||||||||||||||||||||||||||||||||||||||||||||||||||||||||||||||||||||||||||||||||||||||||||||||||||||||||||||||||||||||||||||||||||